Viessmann: HEMS Financial Analysis
The client, a renowned German manufacturer in the heating and refrigeration industries, sought to enhance their existing SaaS-based Home Energy Management System (HEMS) app. The goal was to introduce a new feature enabling photovoltaic (PV) system owners to efficiently track and analyse key performance and financial metrics — empowering users to make smarter, data-informed decisions about their home energy usage.
Viessmann ViCare App Reference:
https://www.viessmann.co.uk/en/products/control-system-and-connectivity/vicare-app.html

The Problem
PV system owners currently lack a user-friendly tool to monitor the financial performance of their systems. This gap makes it difficult to optimise energy usage or maximise returns, limiting users’ ability to make informed, data-driven decisions.
Objective
Within 36 weeks, design a comprehensive finance feature within the HEMS app that goes beyond tracking energy consumption and billing. The feature should enable PV owners to monitor savings, earnings, and other key financial metrics—helping users to make smarter energy management decisions.
My contribution
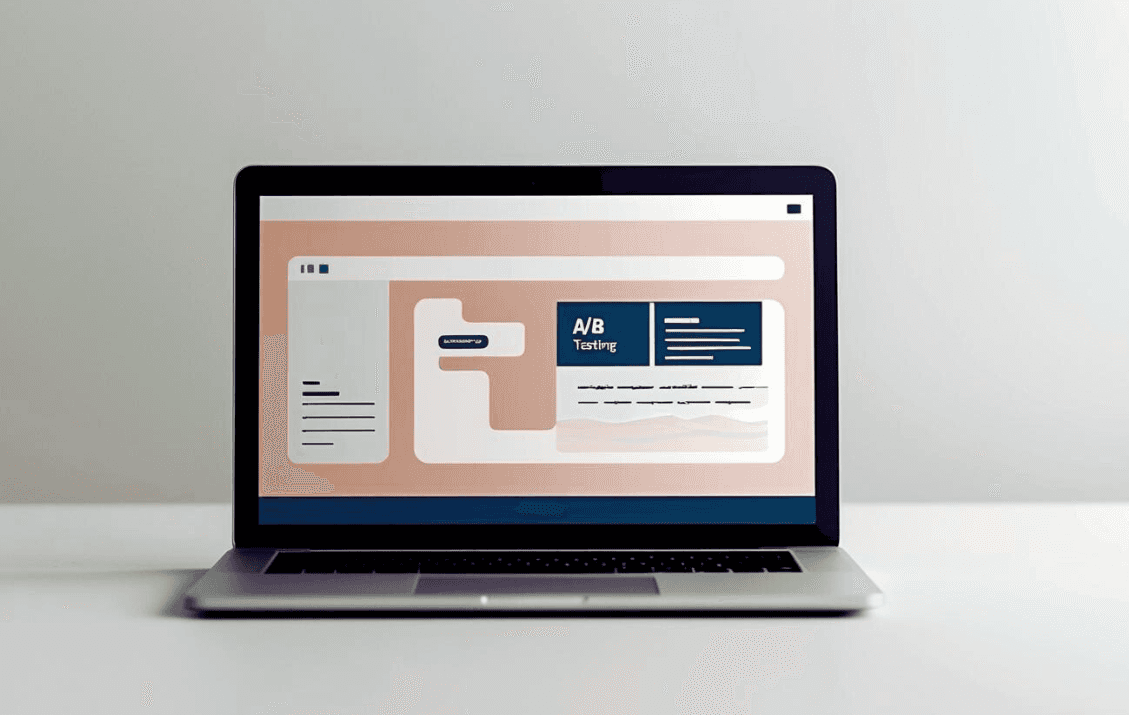
I contributed to a Financial Analysis feature in Viessmann’s SaaS-based energy platform for PV system owners. Working with two UX designers, I conducted research and mini interviews to identify user pain points, followed by A/B testing to compare early concepts. We refined design concepts and wireframes based on feedback, resulting in a clearer, more user-friendly experience aligned with the platform’s goals.

Based on research into existing PV tracking apps and user insights, several key challenges emerged regarding financial analysis features:
Understanding Metrics: Many users, especially younger or new PV owners, struggle to interpret key metrics on energy production, consumption, and financial performance.
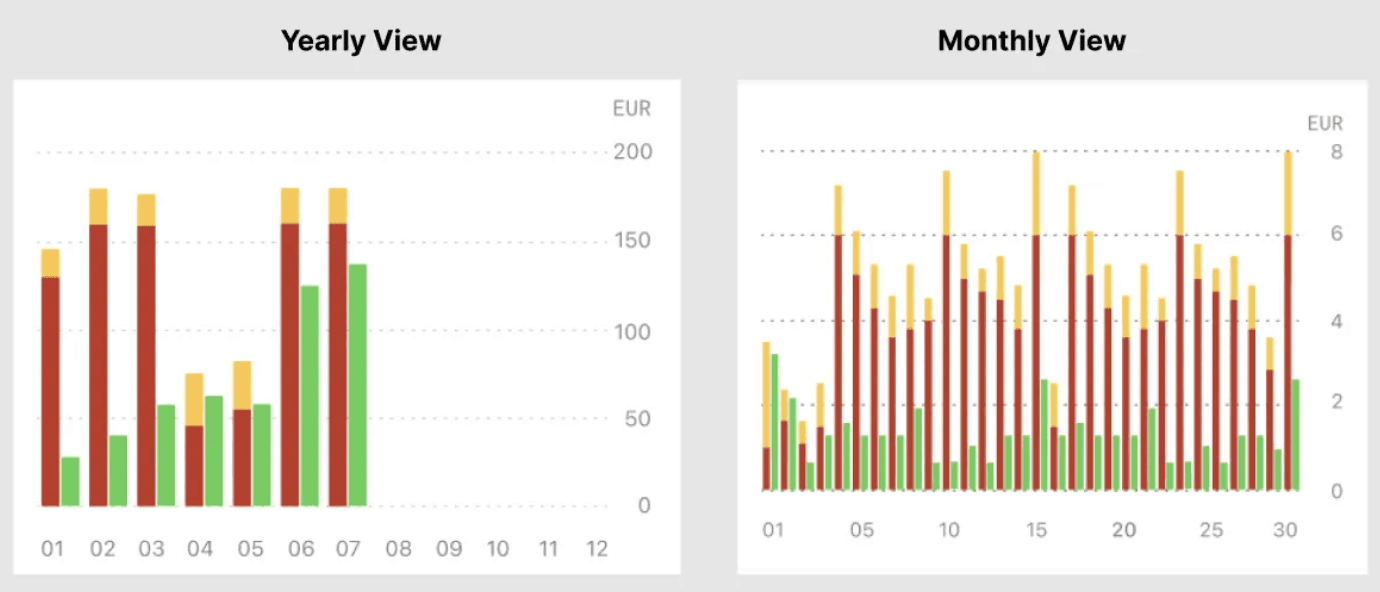
Lack of Financial Context: Most tools display data in kWh only, without converting it into monetary terms (e.g. Euros), leaving users to estimate financial impact themselves.
Missed Opportunities: These gaps prevent users from optimising energy usage and maximising financial returns.


User Interview Process Overview
Identify users’ preferred methods for financial tracking.
Present concept designs and gather feedback on feature clarity and suggestions.
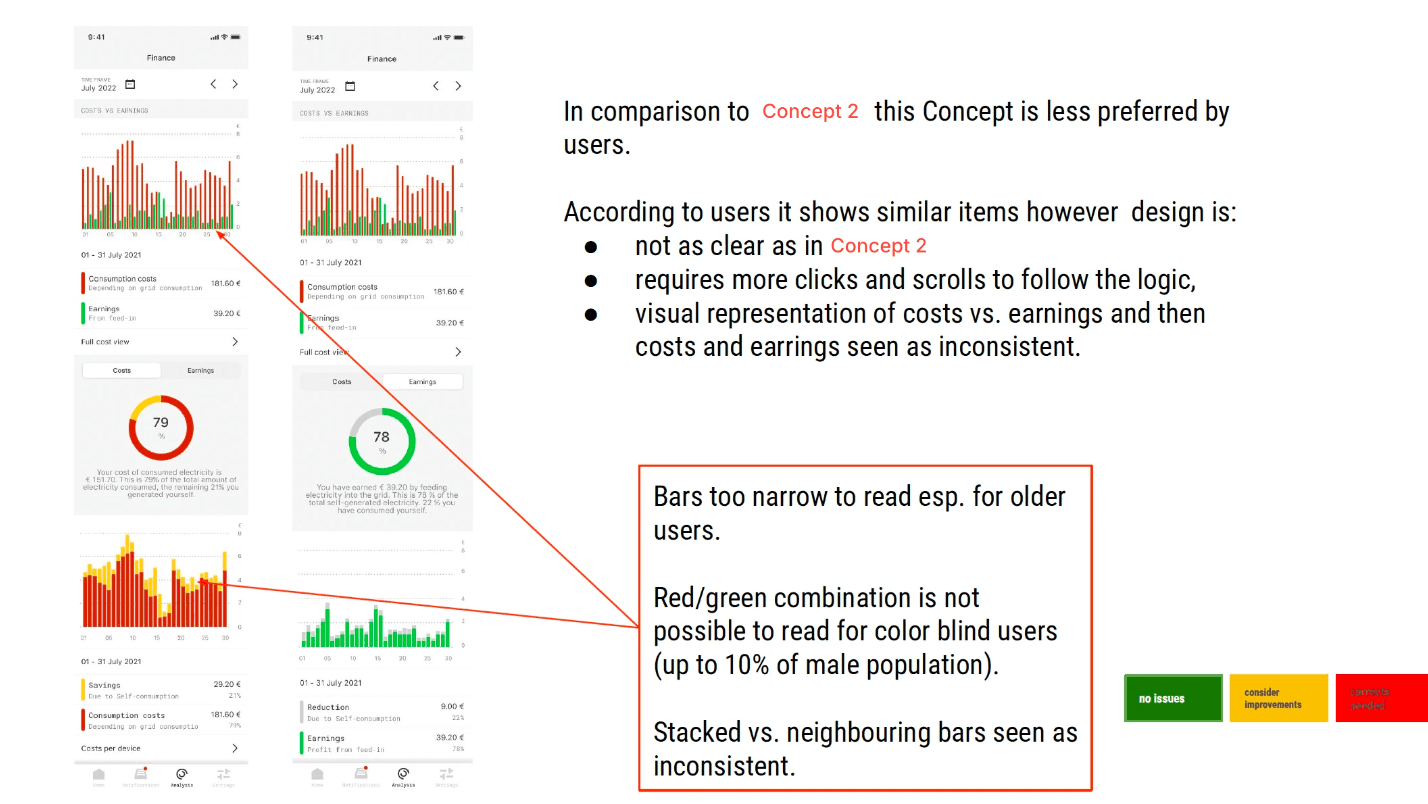
Observe user behaviour while interacting with Concept 1 and Concept 2.
Collect user preferences and comments to determine the more effective concept.
Affinity Map
After the interviews, a digital affinity map was created to categorise user feedback. Responses were colour-coded into three categories based on ease of understanding: "Easy to Understand" (Green), "Somehow Easy But Unclear" (Yellow), and "Difficult to Understand" (Red).


© Gemma Bao Tran, 2025
Email contact: gebao.nt@gmail.com